
The 2022 Pennant - Data Analysis and Observations
Breaking down the 2022 Pennant data to draft more effectively in 2023

The Pennant is Underdog’s playoff MLB Best Ball contest, it is my favourite contest of the year and in my opinion, it is the least understood and worst played best ball tournament I’ve entered on Underdog. You can find the full rules set linked here (https://underdogfantasy.com/rules/tournaments/the-pennant-2022), but these are the highlights:
$10 entry, ~11k entries
6 team drafts, 12 rounds each
Rosters:
3 Pitchers
1 IF
1 OF
2 Flex (Hitters only)
5 Bench
3 Round Tournament:
Round 1 = Wild Card + Divisional Series (⅙ advance)
Round 2 = ALCS/NLCS (⅙ advance)
Finals = World Series
Payout Structure:
1st = $15k
Making the final = min. $100
Advancing from your draft pod = $11
Last year, we were drafting blind off of nothing but intuition and applying some basic game theory - this year, we’re going to change that. We’ve got last year’s data and are going to use that as our starting point to lay out a framework for becoming less bad at drafting Pennant teams, and maybe even good at it. Before we get into anything related to analyzing last year’s results, we NEED to recognize the following things:
This is only ONE (1) year’s worth of data - the smallest of small sample sizes
Analyzing what has happened in a previous year’s tournament IS NOT predictive enough for being successful in the current year alone
Last year’s World Series featured Houston (#1 seed) and Philadelphia (#6 seed), a unique combination which shapes some of the results we’ll see in the data below
We are so early in the learning stage for the Pennant, that the only goal is for us to be directionally correct in a way that is going to limit the number of outwardly bad teams we draft and stack small edges to move enough teams forward and hope variance can go our way
With all of that in mind, I need to repeat this:
I am not telling you how to draft strictly based on the very small, narrow range of results we observed last year - I am trying to identify what we can see as obviously bad, potentially good and (equally as importantly) the areas we can’t give a concrete answer to (yet).
We’re going to use all of that to identify some rules of thumb and basic guardrails to put in place when drafting Pennant teams to avoid disastrous builds during a draft and maximize our chances at the top prize. This piece is going to be my attempt to put numbers to some of the most frequently asked questions from last year’s discussion and see if we can identify the obviously bad, potentially good and unknown areas of playoff MLB best ball. My next piece will be using these principles to start developing a forward looking plan in order for us to start attacking drafts in a smart, thoughtful manner.
All of the main types of data below are going to fall into one of these two buckets:
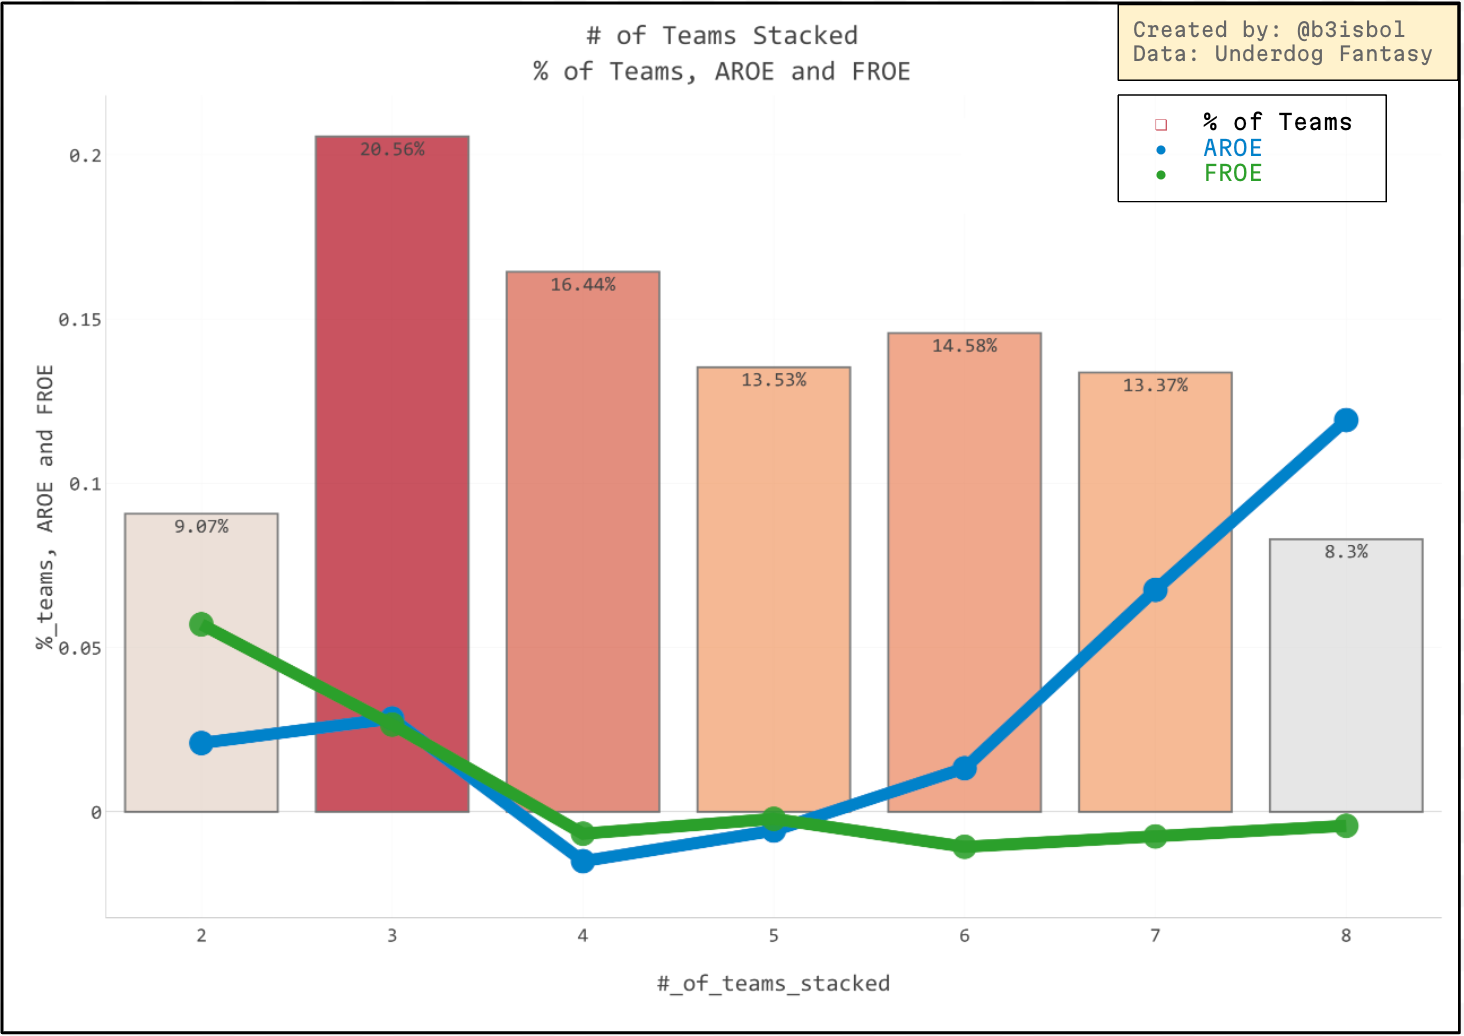
Draft Frequency (bars = % of teams drafted) - how often did the field do X during drafts? This is data we know about our team at the time of drafting (# of teams stacked, # of pitchers, etc.)
Success Rate (lines = AROE and FROE) - how successful were different approaches at advancing in the tournament? This is data we can’t know until after the games are played
As we go through each of the following sections, we need a structured and consistent way of looking at each scenario and analyzing the data - I’m going to use the following:
Analysis Framework:
What happened in PY?
What was the optimal approach in PY?
How can we apply that to CY?
I’m also going to use several standard metrics in order to quantify last year’s results including:
Advance Rate Over Expectation (AROE)
= Advance Rate (% of teams that advanced from Round 1/total # of teams) - 16.67% (1/6 teams in each draft pod make the playoffs)
Final Rate Over Expectation (AROE)
= Final Rate (% of teams that made the final/total # of teams) - 2.78% (1/6 teams in each draft pod advance from Round 1 * 1/6 teams in Round 2 make the final)
Going back through the discussions around the Pennant during the drafting period, led me to the following questions that we were the most curious about at the time. These big questions are the main topics I wanted to look into first:
How many MLB teams should you stack?
How many players should you have available for the final?
How many pitchers should you draft?
How many players on bye teams can you take?
Does it matter how close your draft is to the playoffs?
If any of you were following me at the time, you know that I had some strong convictions about how we should be drafting/playing the contest and it added to the fun of the sweat that we truly had no way of knowing beforehand. One of the best reasons for doing this type of data analysis is backtesting our previous assumptions about how to attack the contest and self evaluating the process we took in the past and how to improve in the future. I hope that this work will at the very least have you start asking the right questions and challenging my assumptions/interpretations where you see fit. A lot of the most eye opening and fun stuff to analyze that I’ve come up with has been born from an argument in Discord or from someone’s claim on Twitter - its all part of the learning and testing process, so please reach out and chime in with any feedback or questions that you have. The six of us are all excited to grow the UD MLB best ball game and have big plans to do so over the course of the off-season. I'm hoping this will help kick us off and open the door for even further deep dives and research into the depths of this year’s Dinger data. Enjoy!
How many MLB teams should you stack?
The most common, most important (in my opinion) and most debated topic of last season’s drafts was about how many teams you should be stacking in your draft and so this was the absolute first thing I looked at.
I was blown away.
By the end of last draft season, I thought we had reached a consensus on 2 or 3 teams being the optimal approach with 4+ teams distantly beyond. Turns out I was living in my own UD bubble:
2 teams stacked = 10%
3 teams = 20%
4+ teams = 70%
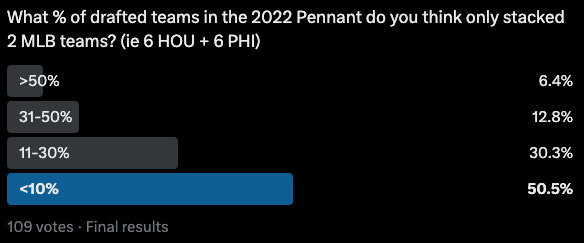
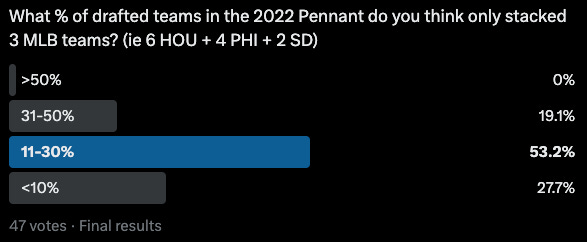
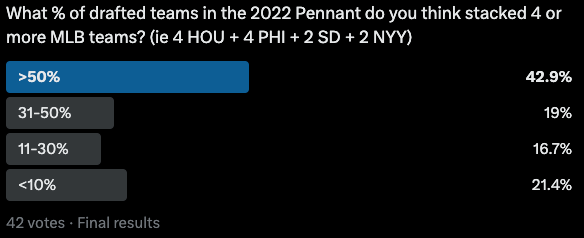
I put the same question up on Twitter, just to see if people were roughly in line with what I expected or if I was the one way off base - congrats to the voters, because your expectations were much closer to reality than my own:
Now, simply binning the results can skew the fact that not all 3 team or 4 team stacks are created equal (hold that thought) but overall, I think this is a good summary representation of how people drafted last year. From simply a volume perspective, 3 team stacks were the most common followed by 4, 5, 6 and 7 team stacks, and then finally 2 team stacks. The success rate data (AROE and FROE) tell a different story.
FROE followed a very simple and consistent trend:
The more teams you stacked, the less often you advanced to the final compared to your expectation.
Full transparency, I was aggressively trying to stack 2 teams and 2 teams only for most of last drafting season and it ended up going well for me. One of the most common counters to only drafting 2 teams was that “Yes, if you make the final with the right combo its great but otherwise the path to get there will be harder”. We’ll get to the AROE data in a minute but for now, regardless of level of success you had in the final you were more likely to get there by stacking only 2 teams compared to every other option.
AROE was less straightforward than FROE but we can still try to apply some logic to the results. The highest AROE buckets were 8 and 7 team stacks, followed by 3 and 2, then 4-7. Why did 8 and 7 team stacks advance so well? Mostly due to spreading around their pitching and targeting Ps on teams that were guaranteed to start a game in the WC round, along with 1 or 2 good hitters from teams that were less likely to advance. Theoretically, it is sound to spread your risk and pile up points from teams that are in the WC and DS rounds of the playoffs - the problem is that only 4 MLB teams are left after those rounds and you’re left with a Swiss cheese roster of zeroes to try and advance again to the final. Enjoy the $1 profit reward for advancing though.
If we narrow in on the more realistic range of team stacks, we do see that in terms of AROE: 3 teams > 2 >>> 4 > 5. This also makes sense, as the tradeoff of adding a 3rd team is that you likely have added an additional P that is going to pitch in the WC + DS round, or a hitter that may add to your point total without advancing.
If we look only at teams with 6 or fewer teams stacked (7, 8+ are obviously bad), 2 team stacks:
Were drafted at the 2nd LOWEST rate
Had the HIGHEST FROE
Had the 2nd HIGHEST AROE
Given the way the tournament payout is structured, I think leaning more aggressive and trying to build teams that can make/win the finals is the correct approach in the long run and playing the advance rate game is not going to cut it in playoff MLB best ball. So despite making up <10% of the drafted teams in the tournament, 2 teams stacks were heavily over represented at the top of the most important leaderboard.
With all that in mind, I think we can summarize the question of how many teams to stack into this guideline:
2 is best, 3 is good, 4+ is dead.
How many players should you aim to have available in the final?
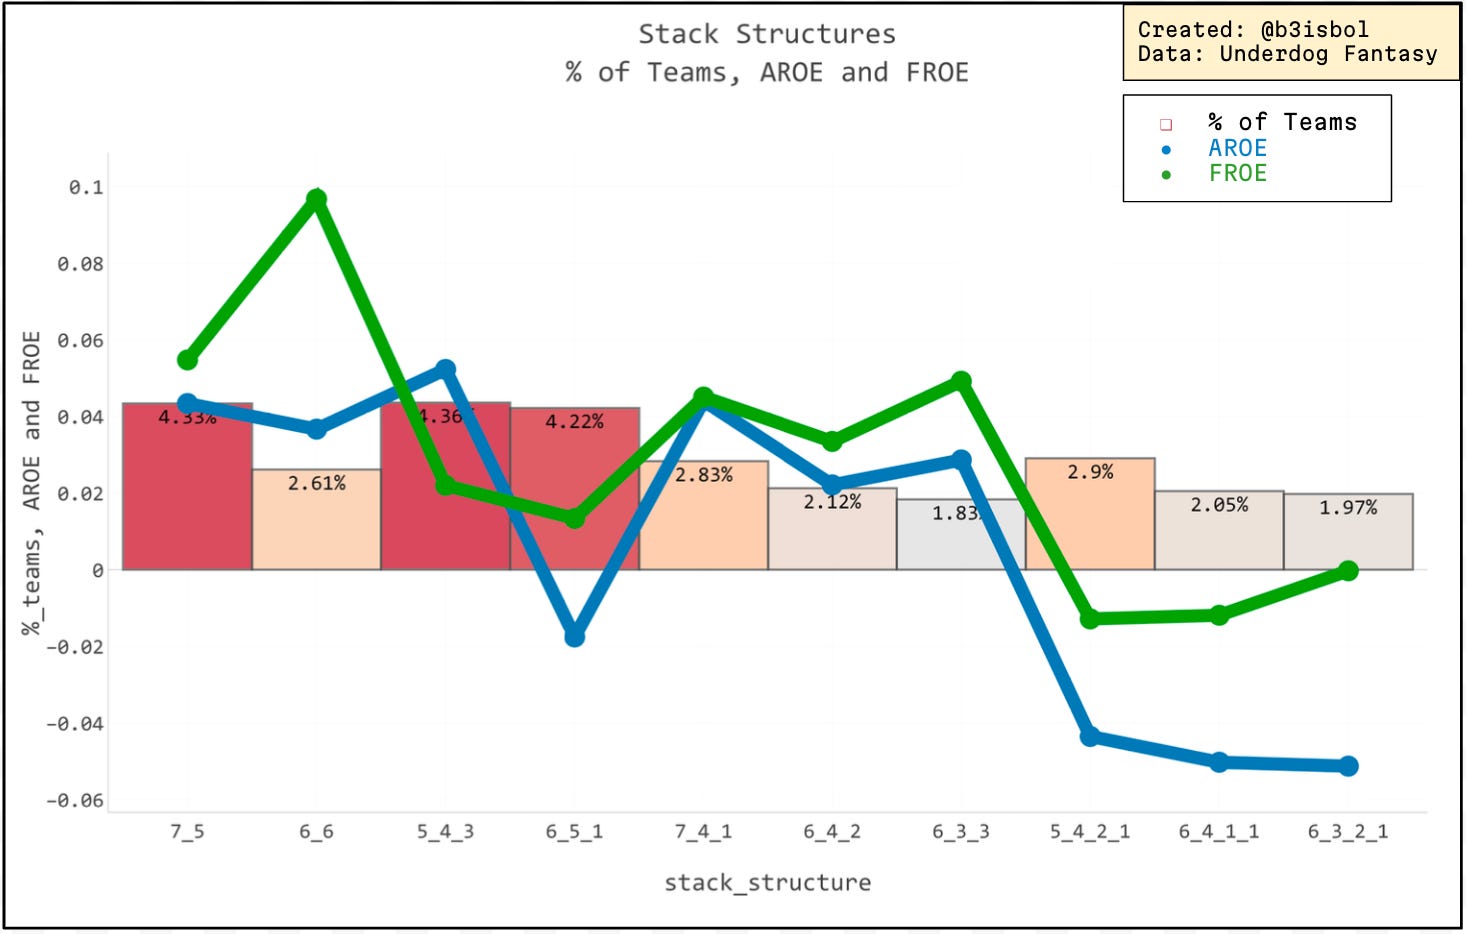
In order to provide more nuance to the question of how many teams should we stack? We need to recognize that not all 3/4/5 etc. team stacks are created equal - we can account for this by looking at:
“If your biggest AL stack and your biggest NL stack meet in the World Series, how many available players will you have?”
This helps to differentiate between a 4-4-4 stack and a 6-5-1 stack, which are fundamentally different things. The data below shows roughly the same picture that was painted above by the number of stacked teams graph.
The FROE relationship has not changed at all from the first graph:

The higher the max available finals players you drafted, the more often you advanced to the final compared to your expectation.
One of the core concepts of MLB playoff best ball that we don’t emphasize enough is how little success in this tournament is about knowing fantasy or even best ball. The Pennant is a futures betting contest, and the most important thing above all else is choosing the right MLB teams to advance later in the playoffs. Drafting only 2 teams actually lowers the amount you need to get right in order to be successful - you need to pick 2 of the final 4 teams alive in the playoffs. Drafting 3 (or 4) requires a higher level of precision - in order to keep your number of available players up, you need to thread the needle on all of their teams advancing to do so.
The AROE results here also mirror the first graph but with a few slight changes - breaking out the 3 and 4 team stacks into these categories actually lowered the overall AROE for those buckets to below the level of 2 team stacks. For fun, I also ran these graphs based on specific stack structure, to split out the most common 2/3/4 team builds:
To extend the thought a bit further and for a look at how different types of teams actually fared in the final, I ran the results from last year’s final against the payout structure and tallied how much prize money was won by each max_final_size_team group above. Remember, this is an even smaller sample than our overall tournament and the payout structure is very top heavy.

This is a rough estimation as I averaged out the Round 2 payouts between $11, $12 and $14 since pod level Round 2 data wasn’t available - I believe this is pretty correct for finals payouts at least. The way to interpret this graph is that despite drafting a 12 person final team (aka a 2 team stack) only represented ~9% of all teams drafted, they took home ~34% of the prize money.
If we go deeper and look at the top 20 final scores from last year, you can see that 2 team stacks included:
The Winner
6 of the top 12
12 of the top 19
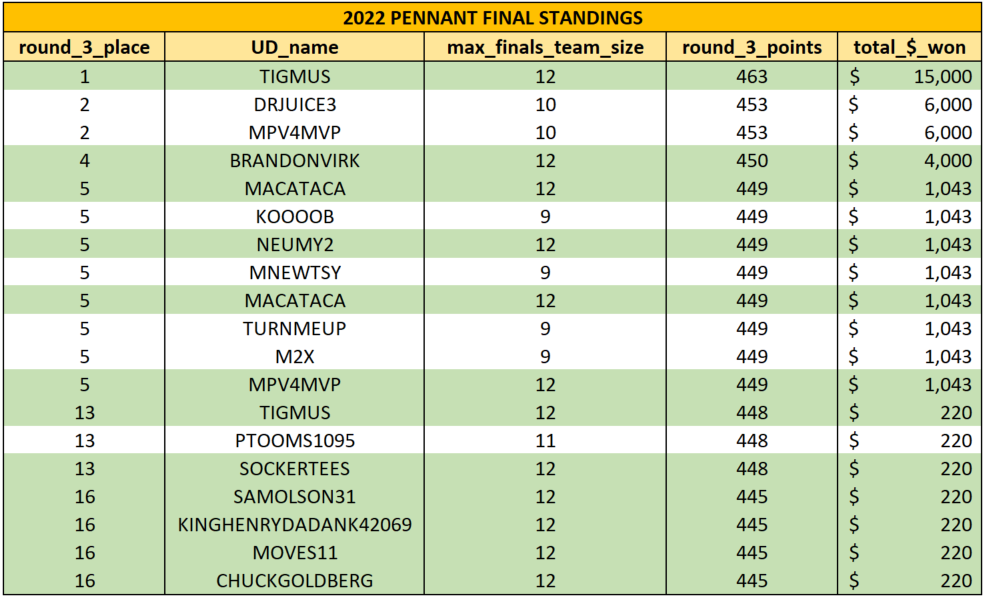
Once again, despite only being ~9% of total teams drafted. I’m fairly convinced that at a minimum we are under-drafting 2 team stacks, and over-drafting pretty much everything else.
Taking what we know here now and adding it to what we learned above, we can tweak our guideline on how many teams to draft:
2 is best, if you draft 3 then take no more than 2 from the 3rd team, 4+ is still dead.
How many Pitchers should you draft?
With the simplified positional setup in The Pennant, the most interesting positional allocation decision is how many pitchers to take. Since 3/7 of your starting players each round are pitchers compared to only 3/10 as pitchers in regular season best ball, the relative importance of pitchers to position players is increased in the playoffs. With that said, there was a narrow band of distributions for the number of pitchers drafted per team in 2022:

80% of teams drafted 4 or 5 pitchers, with the roughly 20% remaining split between 6 and 3 pitcher teams. The trends here are not as strong or as bad as the team stacking ones in my opinion but we can still pull out a few takeaways:
For FROE, the range is small but 5P was the most successful relative to expectation, followed by 4 and 6, then finally 3/7/8.
For AROE, the trend is more straightforward as the more pitchers you draft, the higher your AROE is until you hit 6P. This roughly tracks with our expectation that increasing the number of pitchers (probably with wild card starters) will raise the floor of your lineup and allow you to build a point base in the WC + DS round that can help you advance. The worry with drafting too many pitchers is that you lower your chances of drafting a difference making hitter in exchange for the safety of another arm.
I don’t have as strong a conclusion as I do above, but I think we can sum up pitcher into the following:
5 is ideal, 4 and 6 are fine, everything else is dead.
How many Bye Team Players can you draft?
With the new MLB playoff format in place for 2022, there was an amount of uncertainty around how the playoffs would play out and what the new bye rules would do to playoff teams. For Underdog purposes, the combination of the Wild Card and Divisional Series rounds into the first round of the tournament made for an interesting strategic decision:
Do you take bye teams, with higher odds of advancing to the LCS and WS, or do you lean on Wild Card teams, with more guaranteed games in Round 1 and the upside of 2 start pitchers?
The results were interesting, with the field pretty uncertain about how to attack the new scheduling angle and ended up with the following distribution:

From a frequency perspective, the most common number of bye team players on a drafted team were all between 5 and 8 (~53% of the field combined) - this indicates a large portion of teams had some combination of bye players, either in a team stack or a mini stack.
When we’re considering the relative success rates of the different groups, it is important to remember that Philadelphia (#6 seed) and San Diego (#5 seed) both pulled off DS upsets and faced each other in the CS round. This created a dynamic where the results of non-bye teams were probably overrepresented as we were guaranteed an NL WS team that came from the WC round. On the other hand, the ALCS featured Houston (#1 seed) and New York (#2 seed) - both bye teams. These effects are very tough to isolate and probably cancelled each other out to a degree, but to an extent we cant know.
I think the bye team dynamic is more important when assessing AROE compared to FROE (which is more heavily influenced by team results) and there’s a distinct trend with AROE:
The more bye team players you take, the less likely you are to advance relative to expectation - with the expectation of taking zero bye team players.
The weird dynamic with zero bye team players having a bad AROE and then a huge spike with 1 bye team player, and then decreasing throughout the rest of the range is interesting. I think a large portion of this comes from the fact that the #1 and #2 pitchers on the bye teams were high scorers and had the potential for a 2 start round if necessary - by taking no bye team players, you automatically removed yourself from the possibility of drafting one of these aces, who carried a high upside and a high floor.
AROE takes a severe dive at 8+ players as at that point you just dont have enough games to properly compete with the advancing wild card teams who have already played 2 or 3 games. Overall, I think the field underestimated the value of the wild card teams from both an advancement and longevity standpoint. The wild card teams were at a disadvantage from a seeding perspective but were able to succeed both in terms of scoring points and advancing far enough in the playoffs to matter in later rounds of the tournament. In my opinion, the underutilization of both 2 team stacks and wild card teams might offer us a significant potential edge this year if the field does not adjust fast enough - but that is a topic for my next article.
If we want to summarize:
4-7 is ideal, 2-3 is fine and 1 or 8+ are dead.
How many teams were drafted each week?
Since the Pennant is opened in late August and available all the way until the opening day of the wild card round, the drafting window is open for a long time.

The volume trend here is staggering - 74% of teams were drafted within the last week of the contest close and did the best by a small margin, most likely due to the concrete information available at that time. AROE and FROE trend up slightly throughout the contest life but I really cannot say whether or not this is a meaningful enough edge to be drafting only late in the season. One thing this does tell us is that since an overwhelming number of teams were drafted in the last week when the playoff field is close to set and most information is known, the overall dataset isn’t skewed too much by dead, early drafted teams etc.
One of the biggest edges we were able to pick up on and use last year was getting hyper micro and predicting the playoff pitching rotations for teams in the last week - especially wild card teams. If you were able to nail the rotation for a wild card team, you could probably identify a 2 start pitcher or two to use in the opening round of the tournament, which as we all know from season long MLB best ball, are an absolute goldmine.
Rules of Thumb:
Stacking 2 teams is ideal, 3 is okay, 4+ is bad
If you stack 3 teams, take 2 or fewer players from the 3rd team
Drafting 5 pitchers is ideal, 4 or 6 is good, everything else is bad
Drafting 4-7 bye team players is ideal, 1-3 is fine and 8+ are bad
Draft at any point during the contest life, but save some bullets for the last week
Putting this together has been incredibly fun and I’m very grateful for Tuma getting us access to this data. The Pennant is my favourite tournament of the year and I truly think there is a significant edge to be had if you can draft a portfolio of solid teams within the guidelines we’ve laid out here. As always, you can find me on Twitter (@b3isbol) and you’ll be able to find me here on Stacking Dingers for the foreseeable future too. I’m so excited for everything we have coming up this offseason and am grateful to be working with a great group of people on a sport that we all love. Please reach out with any questions or comments about the data/article/anything else and I’m always open to suggestions on new topics for a deep dive or questions we can try to answer with the data. Next I’ll be trying to figure out how we can apply these general takeaways to the specific landscape of 2023 and see if we can find some edges in the early days of drafts. Also, I’ll be rolling out the 2023 version of the Pennant Google Sheet within the next week or so - any feedback about what you found useful or would like to see included this year is always welcome!